Humans are afflicted with a large number of diseases and other problems. There are several interesting questions related to the occurrence rate of these problems:
For some years now, I have been collecting estimates of the Rate of Human Diseases, Problems and Conditions. I define the "occurrence rate" for a given problem as the percent of people who are affected at least once in their lifetime by that problem. Now that I've put 147 problems into a spreadsheet, I can do some preliminary analysis to begin to answer these questions.
Several caveats should be kept in mind:
I will continue to add problems, and when I accumulate a significantly expanded set, will revisit this analysis.
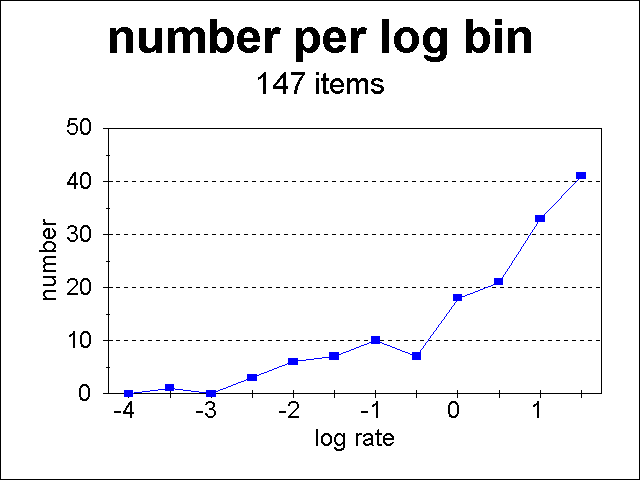
With those caveats in mind, the following plot shows the number of human problems plotted versus logarithmic rate bins. Each bin is 0.5 wide in log10 {rate in %}, and hence contains problems that have the same rate within a factor of 3.16. The first bin on the right, with the largest number of problems, contains all problems with rates of 32% to 100% (log rates of 1.5 to 2.0).
There are significantly more problems that occur at high rates than ones that occur at low rates. There are several probable reasons for this:
If there are 100 problems that occur at the rate of 1%, then you should expect to suffer one of those problems on average. If I add up the rates of problems, starting from the rarest problem, the point at which the rate gets to 100% tells me that I should expect to suffer one problem whose rate is below that point.
This sounds like a mouthful, but it is a simple concept. Suppose that this is the entire universe of problems and their rates:
Hence the answer in this case is that on average every person in that hypothetical universe would expect to suffer from at least one problem that occurs in no more than 3% of the population. This is true no matter how many problems there are that are more common, since one simply adds up the total population rate starting from the least common diseases, to answer my question.
The following two plots give the cumulative rate of human problems plotted versus the rate of the last problem added to the cumulative total, with the second plot simply having an expanded scale to see where the cumulative rate equals 1:
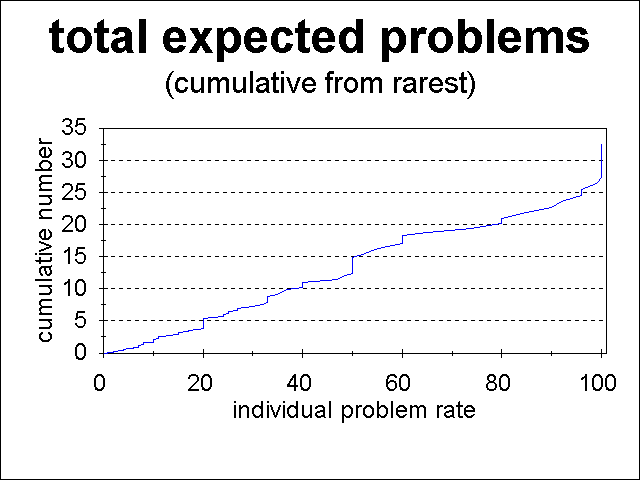
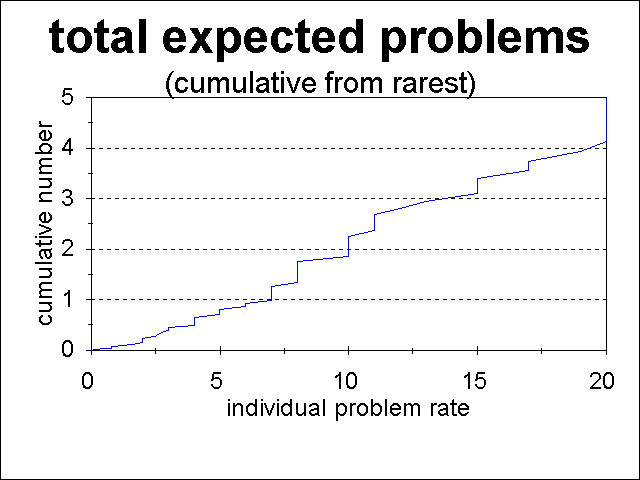
The rate at which the cumulative rate is 1.00 gives the answer to the question. In this case, the cumulative rate reaches 1.00 at a rate of 7%. Thus every human should expect to have at least one disease which occurs in 7% or less of the general population.
Because my list of problems is incomplete, the answer of "a rate of 7%" is an upper limit, and it is likely that the true answer is a rate well under 7%. As I add more problems to my list, I'll explore how that rate decreases.
Note that on average a person should suffer from 33 of the problems in my list! Sigh......
My calculation actually gives the expected rate of problems in a population, and not the probability that the entire population suffers at least one problem. Technically, 36% of that population will not suffer at least one of these problems since the correct way to calculate the rate of the population with those problem rates is to calculate the probability that a given person will have none of those problems. That probability is:
(1-.01)10 * (1-.02)15 * (1-.03)20 = 0.36.
In the interests of simplicity, I have neglected the difference between 0.64 and 1.00! This neglect simply reinforces the fact that my calculation gives an upper limit to the answer.
Go To:
Copyright © 1997 by Tom Chester.
Permission is freely granted to reproduce any or all of this page as long as credit is given to me at this source:
http://la.znet.com/~schester/calculations/analysis_of_rate_of_rare_problems.html
Comments and feedback: Tom Chester
Last update: 15 December 1997.