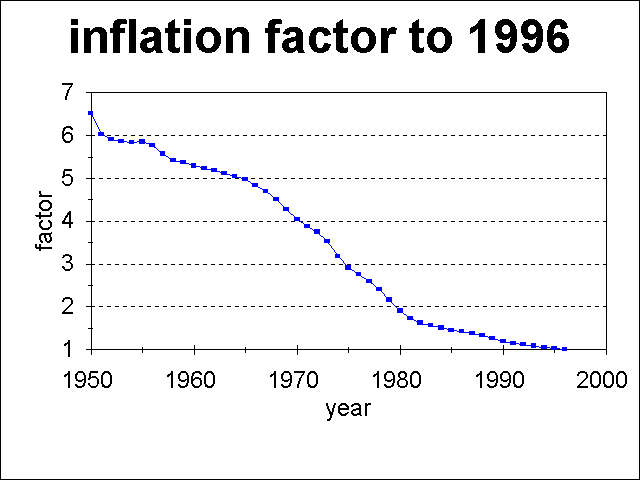
Plot of Inflation Factor to convert from 1950-1996 dollars to 1996 dollars
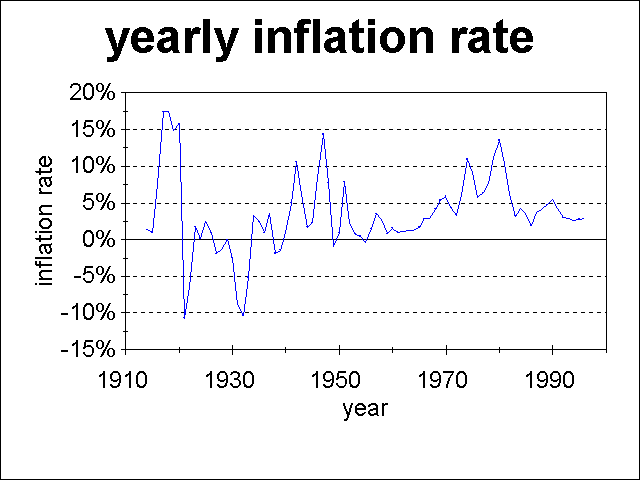
Plot of Yearly Inflation Rate from 1913 to 1996
See also: Inflation Calculators.
Example: to convert from 1982 dollars to 1996 dollars, multiply the 1982 dollars by 1.63. Thus a salary of $30,000 per year in 1982 is equivalent, inflation-wise, to a salary of $48,900 per year in 1996.
| Year | CPI | Conversion Factor to 1996 | yearly inflation rate |
|---|---|---|---|
| 1913 | 29.7 | 15.82 | |
| 1914 | 30.1 | 15.61 | 1.3% |
| 1915 | 30.4 | 15.46 | 1.0% |
| 1916 | 32.7 | 14.37 | 7.6% |
| 1917 | 38.4 | 12.24 | 17.4% |
| 1918 | 45.1 | 10.42 | 17.4% |
| 1919 | 51.8 | 9.07 | 14.9% |
| 1920 | 60 | 7.83 | 15.8% |
| 1921 | 53.6 | 8.77 | -10.7% |
| 1922 | 50.2 | 9.36 | -6.3% |
| 1923 | 51.1 | 9.20 | 1.8% |
| 1924 | 51.2 | 9.18 | 0.2% |
| 1925 | 52.5 | 8.95 | 2.5% |
| 1926 | 53 | 8.87 | 1.0% |
| 1927 | 52 | 9.04 | -1.9% |
| 1928 | 51.3 | 9.16 | -1.3% |
| 1929 | 51.3 | 9.16 | 0.0% |
| 1930 | 50 | 9.40 | -2.5% |
| 1931 | 45.6 | 10.30 | -8.8% |
| 1932 | 40.9 | 11.49 | -10.3% |
| 1933 | 38.8 | 12.11 | -5.1% |
| 1934 | 40.1 | 11.72 | 3.4% |
| 1935 | 41.1 | 11.43 | 2.5% |
| 1936 | 41.5 | 11.32 | 1.0% |
| 1937 | 43 | 10.93 | 3.6% |
| 1938 | 42.2 | 11.14 | -1.9% |
| 1939 | 41.6 | 11.30 | -1.4% |
| 1940 | 42 | 11.19 | 1.0% |
| 1941 | 44.1 | 10.66 | 5.0% |
| 1942 | 48.8 | 9.63 | 10.7% |
| 1943 | 51.8 | 9.07 | 6.1% |
| 1944 | 52.7 | 8.92 | 1.7% |
| 1945 | 53.9 | 8.72 | 2.3% |
| 1946 | 58.5 | 8.03 | 8.5% |
| 1947 | 66.9 | 7.02 | 14.4% |
| 1948 | 72.1 | 6.52 | 7.8% |
| 1949 | 71.4 | 6.58 | -1.0% |
| 1950 | 72.1 | 6.52 | 1.0% |
| 1951 | 77.8 | 6.04 | 7.9% |
| 1952 | 79.5 | 5.91 | 2.2% |
| 1953 | 80.1 | 5.87 | 0.8% |
| 1954 | 80.5 | 5.84 | 0.5% |
| 1955 | 80.2 | 5.86 | -0.4% |
| 1956 | 81.4 | 5.77 | 1.5% |
| 1957 | 84.3 | 5.57 | 3.6% |
| 1958 | 86.6 | 5.43 | 2.7% |
| 1959 | 87.3 | 5.38 | 0.8% |
| 1960 | 88.7 | 5.30 | 1.6% |
| 1961 | 89.6 | 5.24 | 1.0% |
| 1962 | 90.6 | 5.19 | 1.1% |
| 1963 | 91.7 | 5.12 | 1.2% |
| 1964 | 92.9 | 5.06 | 1.3% |
| 1965 | 94.5 | 4.97 | 1.7% |
| 1966 | 97.2 | 4.83 | 2.9% |
| 1967 | 100 | 4.70 | 2.9% |
| 1968 | 104.2 | 4.51 | 4.2% |
| 1969 | 109.8 | 4.28 | 5.4% |
| 1970 | 116.3 | 4.04 | 5.9% |
| 1971 | 121.3 | 3.87 | 4.3% |
| 1972 | 125.3 | 3.75 | 3.3% |
| 1973 | 133.1 | 3.53 | 6.2% |
| 1974 | 147.7 | 3.18 | 11.0% |
| 1975 | 161.2 | 2.92 | 9.1% |
| 1976 | 170.5 | 2.76 | 5.8% |
| 1977 | 181.5 | 2.59 | 6.5% |
| 1978 | 195.4 | 2.40 | 7.7% |
| 1979 | 217.4 | 2.16 | 11.3% |
| 1980 | 246.8 | 1.90 | 13.5% |
| 1981 | 272.4 | 1.73 | 10.4% |
| 1982 | 289.1 | 1.63 | 6.1% |
| 1983 | 298.4 | 1.57 | 3.2% |
| 1984 | 311.1 | 1.51 | 4.3% |
| 1985 | 322.2 | 1.46 | 3.6% |
| 1986 | 328.4 | 1.43 | 1.9% |
| 1987 | 340.4 | 1.38 | 3.7% |
| 1988 | 354.3 | 1.33 | 4.1% |
| 1989 | 371.3 | 1.27 | 4.8% |
| 1990 | 391.4 | 1.20 | 5.4% |
| 1991 | 408 | 1.15 | 4.2% |
| 1992 | 420.3 | 1.12 | 3.0% |
| 1993 | 432.7 | 1.09 | 3.0% |
| 1994 | 444 | 1.06 | 2.6% |
| 1995 | 456.5 | 1.03 | 2.8% |
| 1996 | 469.9 | 1.00 | 2.9% |
Data from Consumer Price Index-All Urban Consumers from Bureau of Labor Statistics (check U.S. - all items, select years, then click retrieve data)
Go To Table of Contents for:
Copyright © 1997-1999 by Tom Chester.
Permission is freely granted to reproduce any or all of this page as
long as credit is given to me at this source:
http://la.znet.com/~schester/facts/inflation.html
Comments and feedback: Tom
Chester
Last update: 22 July 1999.