Expected Return From Stocks In Next 5-10 Years
Thomas J. Chester
3 February 1997
Abstract
The expected inflation-adjusted returns from stocks over the next 5 to 10 years are negative under almost all reasonable assumptions about the future earnings of companies in the S&P 500 and about the price/earnings multiple that investors are willing to pay for stocks. Only one scenario forecasts good returns for stocks: that baby-boomers will bid prices to unheard-of levels as they invest their retirement money.
Prudent investors should reduce their allocation to stocks now, unless doing so would involve paying significant capital gains taxes.
Navigation
Introduction |
Earnings and Stock Prices |
Earnings Growth |
P/E Ratios |
Predicted stock returns |
Recommended Strategies
John C. Bogle, the chairman of Vanguard, published in 1991 a straightforward way to determine the expected returns from large cap stocks in a given time interval (Bogle 1991a&b) that closely predicted the returns for 1990-1994 (Bogle 1995). (See also Vanguard Chairman Urges Rational Expectations.) However, the explosion in stock prices in
1995 and 1996 has significantly exceeded Bogle's most optimistic prediction and prompted me to reexamine the basis of his predictions.
In this article, I apply Bogle's basic approach, but with more attention to deriving the earnings growth rate that he assumed. I also update the predictions using the current levels of the stock market.
Section II gives a basic review of how earnings determine stock prices. Section III analyzes the inflation-corrected earnings of the S&P 500 stocks in order to derive reasonable growth rates, along with maximum and minimum earnings deviations. Section IV analyzes the price/earnings ratio (P/E) variation of the past. Section V uses these results to predict the return of the S&P 500 over the next 5-30 years. Section VI gives possible courses of action to maximize one's investment returns.
The share price (P) of a stock
can be written in terms of the company's earnings per share (E) as:
stock price = (P/E) * earnings.
This apparent tautology is justified because earnings are the main foundation of stock prices. Fundamentally, when
you buy a stock,
you are purchasing an ownership share in that company. If a company's
earnings represent 5% of the total value of all of their stock, you
are purchasing a current yield of 5% on your money invested.
Two other factors influence the amount an investor is willing to pay for
a given amount of earnings:
- Current and forecast future interest rates, and
- Investor expectations of future earnings.
Interest rates directly affect the P/E multiple: if interest rates go up,
the P/E multiple must decline, so that an investor is purchasing the
company's earnings at a competitive market rate. For example, suppose a company earns $1 per share. If interest rates were 10%, the P/E might be 10, with a resulting share price of $10, giving an "earnings yield" of 10% for the purchased shares. If interest rates were 5%, the P/E might be 20, with a resulting share price of $20, giving an "earnings yield" of 5% for the purchased shares.
Of course, by purchasing the stock, you take on whatever prospects and risks the company faces in the future. If the company is consistently growing earnings at 20% per year,
and is expected to continue to do so with little risk, investors are willing
to accept a lower current earnings yield, and hence a higher current P/E
ratio, in expectations of getting much higher earnings in future years.
Conversely, if the continued viability of the company is in question,
investors will demand a higher current earnings yield, and hence a lower
current P/E ratio, to purchase the stock.
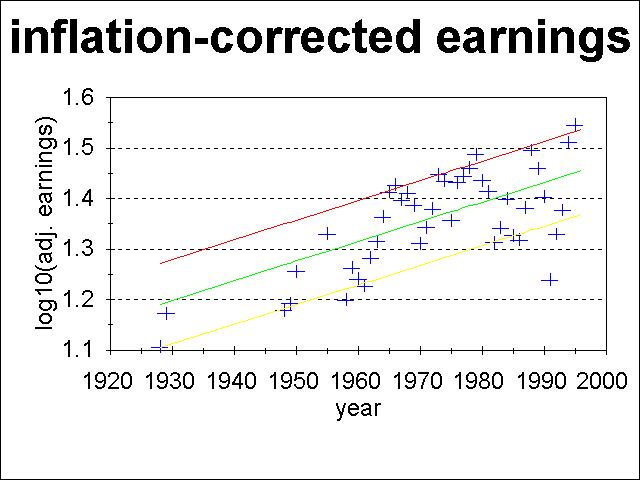
Fig. 1
shows the log10 earnings of the S&P 500 companies, adjusted to constant
1996 dollars, versus time. I obtained the reported earnings of
the S&P 500 from Tables 18.3 and 18.4 of Renshaw 1996,
and used the CPI for all urban consumers from the Bureau of Labor Statistics 1997.
It is important to analyze inflation-adjusted earnings to understand
the true growth rate of earnings. For example, a plot of the non-inflation-adjusted earnings appears to show a "break" in the linear fit around 1960,
with a higher earnings growth after 1960 than before it. This is apparently caused solely by higher inflation post-1960, and not by some other fundamental change at that time.
I fit a straight line to the data of Fig. 1, using only the points after 1957, and adjusting the value for 1991 upward to the yellow line in Fig. 1. The 1991 adjustment was necessary due to the special write-offs caused by a major accounting change that lowered reported earnings in those years. I did not use the earlier points because they are not a complete sample, and because those points in the plot represent only "peak" earnings years. Fitting a straight line in Fig. 1 is equivalent to fitting a constant growth rate to earnings.
(Click on graph or link for bigger and better image.)

Fig. 1. Inflation-adjusted earnings of the S&P 500 versus time. The abscissa plots the log10 of earnings per share expressed in 1996 dollars. The central green line is the best-fit line to the data points after 1957. The upper red line was fit by eye to the peak earnings. The lower yellow line was fit by eye to trough earnings, ignoring the 1991 data (see text).
Three major conclusions can be drawn from Fig. 1:
- Inflation-corrected earnings of S&P 500 stocks have grown at a remarkably constant rate of about 1% per year from 1928 to 1995.
- Peak earnings are roughly 20% above the average, and trough earnings are roughly 20% below the average.
- 1995 earnings fall on the peak earnings line, and thus are 20% above average.
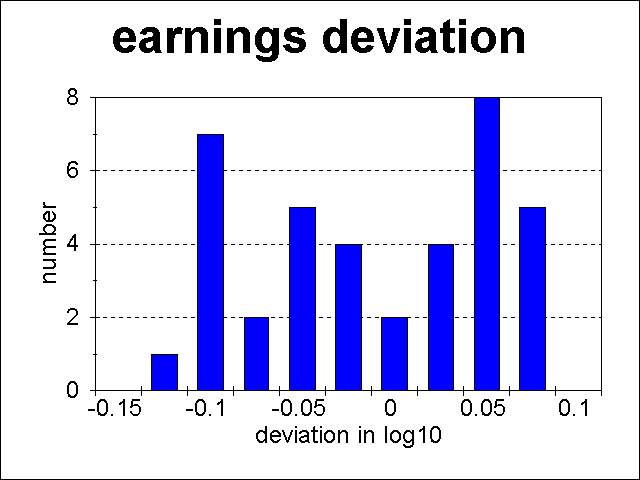
I note in passing that the residuals about the best-fit line are far from Gaussian, and are more nearly uniformly distributed, if not anti-Gaussianly distributed! Fig. 2 shows a histogram of the residuals post-1957.
(Click on graph or link for bigger and better image.)

Fig. 2. Residuals about the best-fit line of Fig. 1 for the log10 of earnings per share expressed in 1996 dollars. The ordinate labels go with the point to their left. Hence the bin from 0 to 0.025 contains 2 points.
Now that we understand the earnings of the S&P 500, we need to understand the P/E ratio variation. The P/E ratio is actually not just one variable because there are different conventions about what time period to use for the Earnings. (The price is always taken to be the current price.) The extreme values come from using a full past year of earnings (the lagging P/E ratio) and from using an estimate of the full next year of earnings (the leading P/E ratio).
Fig. 3 shows both of these estimates versus time, along with the bond yield at the end of each year, which gives an interest rate to measure the P/E variation against.
(Click on graph or link for bigger and better image.)

Fig. 3. Historical P/E ratios of the S&P 500 versus time for lagging (blue) and leading (green) earnings, as well as the bond yield (red) versus time.
Note the clear variation of the P/E ratio regardless of type with interest rates. When interest rates are low, 5-7%, the P/E ratio is between 15 and 20. (Again, 1991 was an exceptional year for reported earnings.) When interest rates are high, 10-15%, the P/E ratio drops to between 7 and 10.
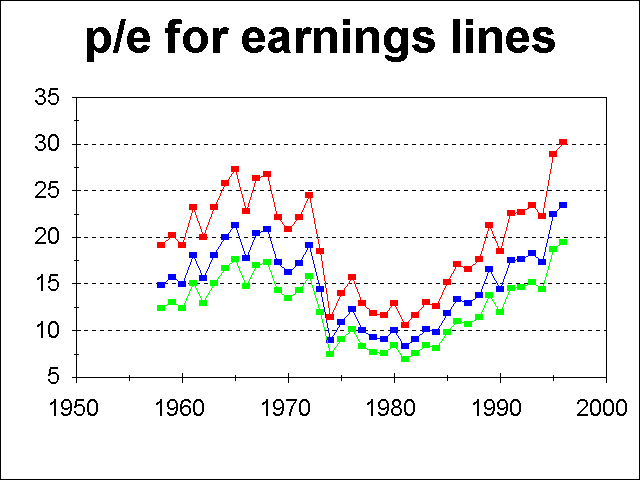
Because of the variability of earnings, it is more useful to plot the P/E ratio using the lines shown in Fig. 1. That plot is given in Fig. 4.
(Click on graph or link for bigger and better image.)

Fig. 4. Historical P/E ratios of the S&P 500 versus time, using minimum (red), mean (blue) and maximum (green) fits to earnings.
Note how irregularities like 1991 disappear on such a plot, and make it clear that at the end of 1996, in fact the P/E had reached a record high value. By comparison, Fig. 3 seemed to show that 1996 was unexceptional after the record peak due to the 1991 aberration.
I have altered Bogle's prescription for calculating the expected return from stocks to give the inflation-adjusted return. The modified prescription is to add up the following components:
the dividends generated by stock, the earnings growth, and expected changes in the P/E ratio.
The dividend yield is the only known factor, and is currently 2.0% per year for the S&P 500.
Earnings growth was analyzed in Section II, and was found to be 1.0% per year.
The expected change in the P/E ratio is the most uncertain, since it depends on inflation, interest rates, and investor psychology. Since my thesis here is that the expected return from the S&P 500 in the near-term is low, I'll make optimistic assumptions to get an upper bound on the expected return.
The optimistic case assumes:
- Interest rates and inflation remain at current levels.
- P/E ratios range between 17.5 and 20.
Beyond that, I'll consider two cases:
- Earnings revert to their average level over the next 5, 10, 20 or 30 years, or
- Earnings stay at their current high level, 20% above their average level over the last 30 years, and thus that we are in a "brave new world" for U.S. companies and their profits.
Note that both of these scenarios are optimistic, since a priori there is a 50% probability that earnings revert to below-average levels sometime in the future!
It is simple to convert the hypothesized course of P/E ratio changes to an annual growth rate. The annualized growth rate of a P/E ratio change over n years is simply the nth root of the ratio of the final P/E divided by the current P/E. The numbers:
- The value of the S&P 500 on 31 January 1997 was 784.
- The best-fit inflation-adjusted earnings for the end of 1997 are $28.80 per share for the mean earnings, and $34.69 for the best-fit peak earnings. At 17.5 average earnings, the value of the S&P 500 would be 504. At 20 times earnings, it would be 576. The market is 25-34% overvalued using average earnings, and 9-20% overvalued using peak earnings.
- The current P/E ratio using 1997 inflation-adjusted earnings is 22.6 (using peak earnings) to 27.2 (using average earnings).
- For the most optimistic case, assuming that earnings remain at their peak levels and that the P/E changes only from 22.6 to 20.0, the annualized growth rate of that change is -2.4% amortized over 5 years, -1.2% over 10 years, -0.6% over 20 years or -0.4% over 30 years. (Clearly, the annualized growth rate declines as one increases the number of years for the change to occur.)
- For a more realistic optimistic case, assuming that earnings revert to their average levels and that the P/E changes from 27.2 to 17.5, the annualized growth rate of that change is -8.4% amortized over 5 years, -4.3% over 10 years, -2.2% over 20 years or -1.5% over 30 years.
For comparison, consider two other scenarios:
- An average sort of scenario, where earnings revert to average levels, and the P/E declines to 15. The annualized growth rate of that change is -11.2% amortized over 5 years, -5.8% over 10 years, -2.9% over 20 years or -2.0% over 30 years.
- A worst-case scenario where earnings fall to trough earnings levels, and the P/E declines to 10. The annualized growth rate of that change is -21.0% amortized over 5 years, -11.1% over 10 years, -5.7% over 20 years or -3.9% over 30 years.
These numbers are all put together in Tables 1-4:
Table 1: Predicted annualized stock returns of the S&P 500 in the most optimistic case
| | Expected Return
|
|---|
| Component | over next 5 years | over next 30 years
|
|---|
| Dividends | 2.0% | 2.0%
|
| Earnings Growth | 1.0% | 1.0%
|
| Change in P/E Ratio | -2.4% | -0.4%
|
| TOTAL APPRECIATION per year | 0.6% | 2.6%
|
This most optimistic case assumes that earnings remain at peak levels, and the P/E ratio
is 20.
Table 2: Predicted annualized stock returns of the S&P 500 in an optimistic case
| | Expected Return
|
|---|
| Component | over next 5 years | over next 30 years
|
|---|
| Dividends | 2.0% | 2.0%
|
| Earnings Growth | 1.0% | 1.0%
|
| Change in P/E Ratio | -8.4% | -1.5%
|
| TOTAL APPRECIATION per year | -5.4% | 1.5%
|
This optimistic case assumes that earnings revert to average levels, and the P/E ratio
is 17.5.
Table 3: Predicted annualized stock returns of the S&P 500 using average assumptions case
| | Expected Return
|
|---|
| Component | over next 5 years | over next 30 years
|
|---|
| Dividends | 2.0% | 2.0%
|
| Earnings Growth | 1.0% | 1.0%
|
| Change in P/E Ratio | -11.2% | -2.0%
|
| TOTAL APPRECIATION per year | -8.2% | 1.0%
|
This "average assumption" case assumes that earnings revert to average levels, and the P/E ratio
is 15.
Table 4: Predicted annualized stock returns of the S&P 500 in the most pessimistic case
| | Expected Return
|
|---|
| Component | over next 5 years | over next 30 years
|
|---|
| Dividends | 2.0% | 2.0%
|
| Earnings Growth | 1.0% | 1.0%
|
| Change in P/E Ratio | -21.0% | -3.9%
|
| TOTAL APPRECIATION per year | -18.0% | -0.9%
|
This most pessimistic case assumes that earnings plunge to trough levels, and the P/E ratio
is 10.
Summary
The expected inflation-adjusted return of the S&P 500 over the next 5 years is -8% per year. Optimistic assumptions lead to an expected return of -5% to +1% per year. Pessimistic assumptions give -18% for each of the next 5 years!
What could change these predictions for the better?
Two things:
- If baby-boomers pour so much money into the stock market that P/E ratios skyrocket to levels equivalent to those of the Japanese stock market at its speculative-bubble peak, say a value of 40, and earnings stay at record high levels due to technology/better management/(you provide the reason). The annualized growth rate of that change is +12.1% amortized over 5 years, +5.9% over 10 years, +2.9% over 20 years or +1.9% over 30 years. That would lead to an expected inflation-adjusted return of the S&P 500 over the next 5 years of +15% per year, roughly what has happened over the last 15 years.
- If earnings grow faster than previously due to technology/better management/(you provide the reason), then the expected returns are increased by whatever you assume the faster growth rate is over the expected level of 1% per year, say x%. P/E ratios might be expected to remain the same as today's level in that scenario, and hence the expected inflation-adjusted return of the S&P 500 over the next 5 years would be (3+x)% per year.
Assuming that we haven't entered a new era, the best average yearly return that can be expected from stocks in the next 5 years is 1% over the inflation rate. If the inflation rate is 3%, the expected non-inflation-adjusted return would be 4%. This is a far cry from the usual expectations of 10% per year.
The reasons for this are clear:
- The dividend rate is at an all-time low, at 2% compared to the average level of over 4%.
- Stocks are overvalued by around 30%.
What should a prudent investor do?
If there were no tax complications, one should reduce one's U.S. stock allocation to bare minimum levels, but not to zero. It is almost always a bad idea to sell all stocks. My personal ideal allocation now would be 25% to stocks, with most of that to non-U.S. stocks.
(Even though this analysis says nothing about foreign stocks, if U.S. stocks decline significantly, foreign markets will probably do so, too, in the short run.)
However, it is probably inadvisable to sell stocks for which you would have to pay large capital gain taxes. If you have held stocks for more than the last 2 years, you probably have gains of at least 50%. If you were to sell those stocks, the federal and state government would probably take 35% of your profit, leaving you with an immediate "for sure" 12% "loss" in your total invested capital. If your gains are higher, you will lose correspondingly more. In my case, I can only reduce my stock portfolio to 50% of my financial assets, but with most of that in foreign markets.
If you are in that situation, you can at least avoid buying more stocks now. Take your capital gain and dividend distributions in cash, and build up the non-stock portion of your portfolio.
In all cases, the goal would be to increase one's U.S. stock allocation at such time as the market valuations return to more normal levels.
- Bogle, John C. 1991a. "Investing in the 1990s: Remembrance of Things Past and Things Yet to Come." J. of Portfolio Management, Spring 1991, pp. 5-14.
- Bogle, John C. 1991b. "The 1990s at the Halfway Mark." J. of Portfolio Management, Summer 1995.
- Bogle, John C. 1995. "Investing in the 1990s: Occam's Razor Revisited." J. of Portfolio Management, Fall 1991, pp. 88-91.
- Vanguard Chairman Urges Rational Expectations.
Go To:
Financial Advice homepage | Tom's homepage
Copyright © 1997 by Tom Chester. Permission is freely granted to reproduce any or all of this page as long as credit is given to me at this source:
http://la.znet.com/~schester/financial_advice/expected_return_sp500.html
Comments and feedback: Tom Chester
Last update: 5 March 1997.


