(Click on graph for bigger and better image.)

(Click on graph for bigger and better image.)
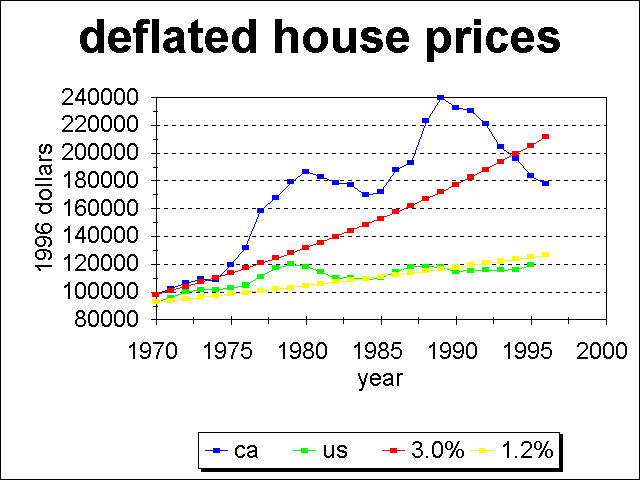
The median home prices of California and U.S. homes in both inflated and deflated dollars is shown in the following two graphs. The left-hand graph below shows the median home price in constant 1996 dollars, along with two curves for comparison: a constant rate of increase of 3.0% to compare the California values against, and a constant rate of increase of 1.2% for the U.S. values.
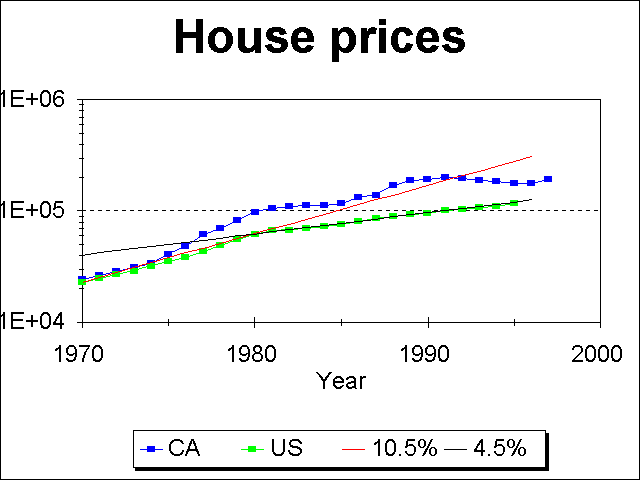
The right-hand graph below shows the median home prices in each year's dollars. The plot uses a log scale, so that a constant rate of increase is a straight line. For comparison, two lines are fit to the U.S. home price data. A line representing an annual rate of increase of 10.5% fits the U.S. before 1980. From 1980 to now, the rate of increase has been about 4.5% per year.
The difference between the fitted curves in the two graphs is mostly inflation, although the curves themselves are fit slightly differently. In the left-hand graph, I tried to fit some "average" rate of increase, allowing the current values to then be considered "depressed" from the average rate of increase. In the right-hand graph, I simply fitted the mean rate of increase for U.S. home prices separately for 1970 to 1980, and 1980 to now.
 (Click on graph for bigger and better image.) |  (Click on graph for bigger and better image.) |
In some areas at some times, real estate has "boomed" and been a superior investment for a few years. If you can identify when and where those periods will occur, you don't need to be reading this document!
There are many, many books, salesmen, etc. which try to sell real estate as a fantastic investment. Generally, these sources conveniently forget to include some of the costs associated with real estate in order to make it appear to be such a good investment, and they almost always decline to talk about the risks involved.
One point to be aware of. Demographics imply that real estate will perform much worse in the future, now that the baby-boomers have moved beyond the period in their lives when they are buying their first homes. Southern California may escape this, but then again it may not. (Factor in what a major earthquake might do to Southern California demand as well!)
Again, beware. Unlike other investments, collectibles have no intrinsic value. Their value is set by supply and demand, which is often fraudulently manipulated. The classic scheme is for a manipulator to start buying up his target property, for example, 50 year old dolls, with attendant publicity. The price of such items soars, and the manipulator is happy to supply the dolls for inflated prices. Once the suckers have been sold the dolls, the price falls and that particular collectible is no longer in fashion.
Copyright © 1997 by Tom Chester.
Permission is freely granted to reproduce any or all of this page as long as credit is given to me at this source:
http://la.znet.com/~schester/financial_advice/real_estate.html
Comments and feedback: Tom Chester
Last update: 12 May 1997.