In a famous experiment, Sir William Herschel discovered the infrared region of the solar spectrum in the year 1800. He used a glass prism to disperse the sun's rays and a thermometer to record the "temperature" of each of the wavelengths. To his surprise, he found that the highest reading of the thermometer was in a region beyond the reddest rays, and thus discovered the infra-red ("below-red"). See Discovery of Infrared.
On first consideration, this result is surprising. The energy peak of the solar spectrum is at 0.60 micron (orange light), and definitely not in the infrared. So why did Herschel observe the highest reading in the infrared?
The answer turns out to be the experimental design, and a failure to correct for refraction. In Herschel's setup, sunlight is refracted by a prism. The index of refraction of course must vary with wavelength so that the sunlight would be dispersed into its various colors. If the index of refraction varied linearly with wavelength, Herschel would not have needed to correct for that variation, since the wavelengths would be uniformly spaced along his table.
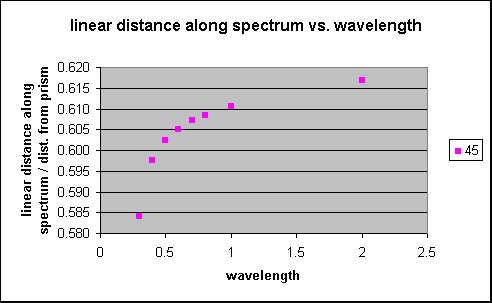
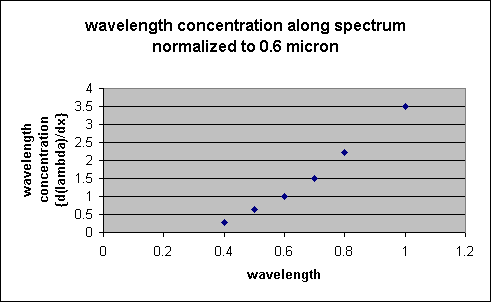
However, since the index of refraction varies non-linearly with wavelength, the wavelengths will not be uniformly spaced along Herschel's measuring table. The actual spacing of the wavelengths versus distance along his table for an incidence angle of 45° from air into glass shows that the infrared region is much more highly concentrated than optical wavelengths. (The plot shows the spacing along the spectrum divided by the distance from the prism. Hence to get the actual spacing in cm or inches, multiply by the distance from the prism in cm or inches.) The relative concentration factor is shown normalized to 0.60 micron.
The net result is that Herschel's observed "temperature" should then peak in the infrared. The energy vs. wavelength plot for the "45° glass" model given above shows that Herschel's observed "temperature" should keep increasing toward longer wavelengths. However, when properly corrected for the relation between wavelength and distance along his table, he should have finally published the "no wavelength concentration" curve shown in that plot!
A good referee should have caught this mistake. (;-)
Go To Table of Contents for:
Copyright © 1998-1999 by Tom Chester.
Permission is freely granted to reproduce any or all of this page as long as credit is given to me at this source:
http://la.znet.com/~schester/calculations/herschel/index.html
Comments and feedback: Tom Chester
Last update: 21 July 1999.